Who we serve · Physicians & care teams
A ranked list, the reason, and the protocol. Not another dashboard.
At chart open, the patients whose conditions are compounding, the interaction named, and the protocol in the words of the guideline that calls for it. You decide. The clinician holds the pen.
- 1Dorothy M.Woman, 81 · CriticalInteractionDiabetic Nephropathy (Moderate)ProtocolActions pending clinical review.
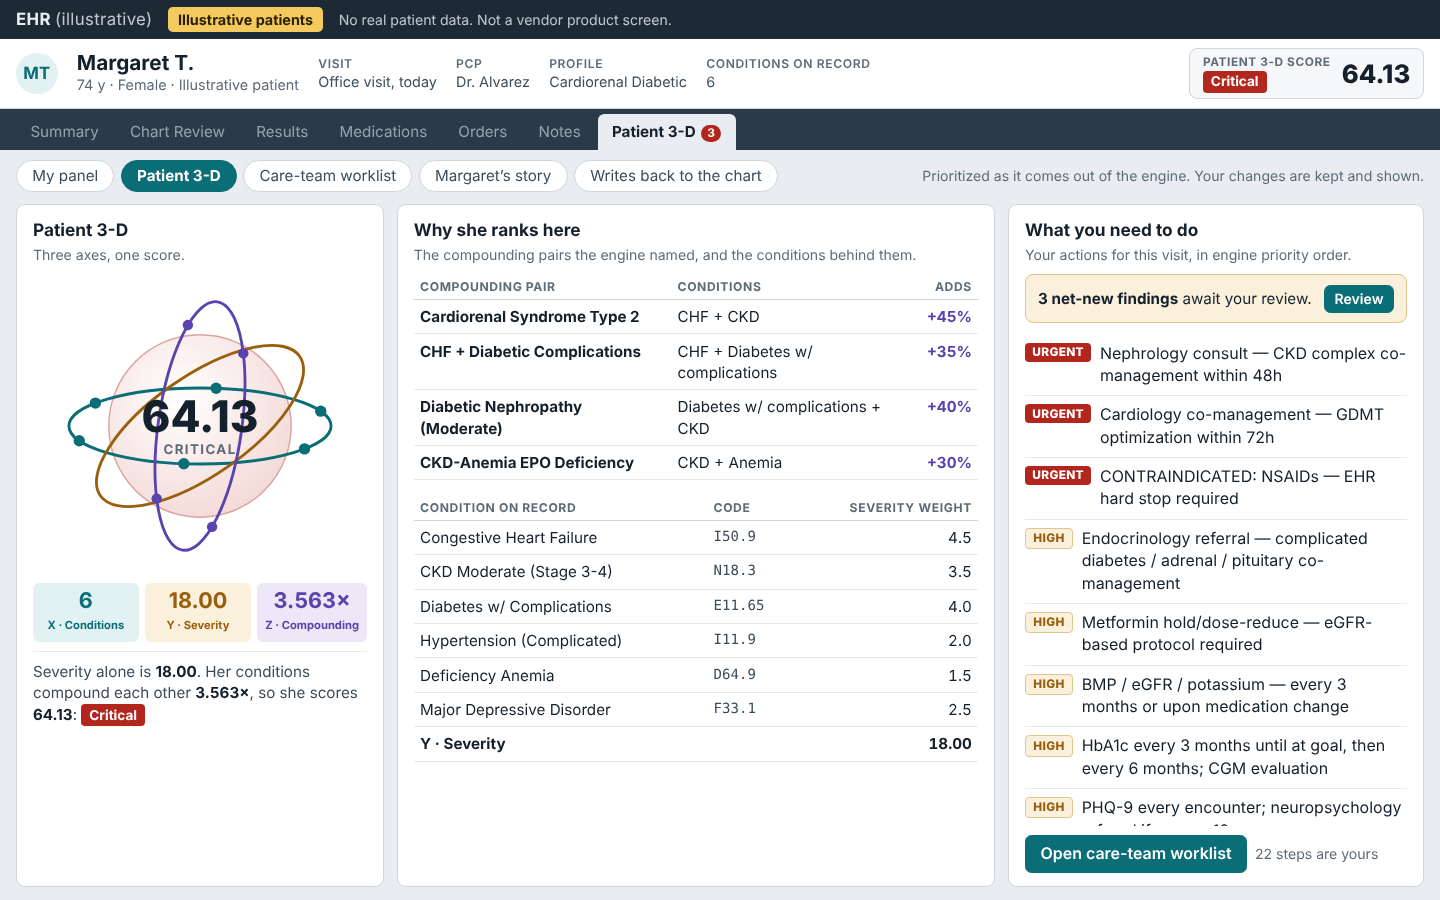
- 2Margaret T.Woman, 74 · CriticalInteractionCardiorenal Syndrome Type 2ProtocolNephrology consult — CKD complex co-management within 48hKDIGO 2024 Clinical Practice Guideline for CKD, Kidney Int, 2024
- 3Robert J.Man, 68 · HighInteractionCHF + AFib Arrhythmia BurdenProtocolActions pending clinical review.
Every protocol can be accepted, changed or disputed. Every response is recorded.
What it looks like in the chart.
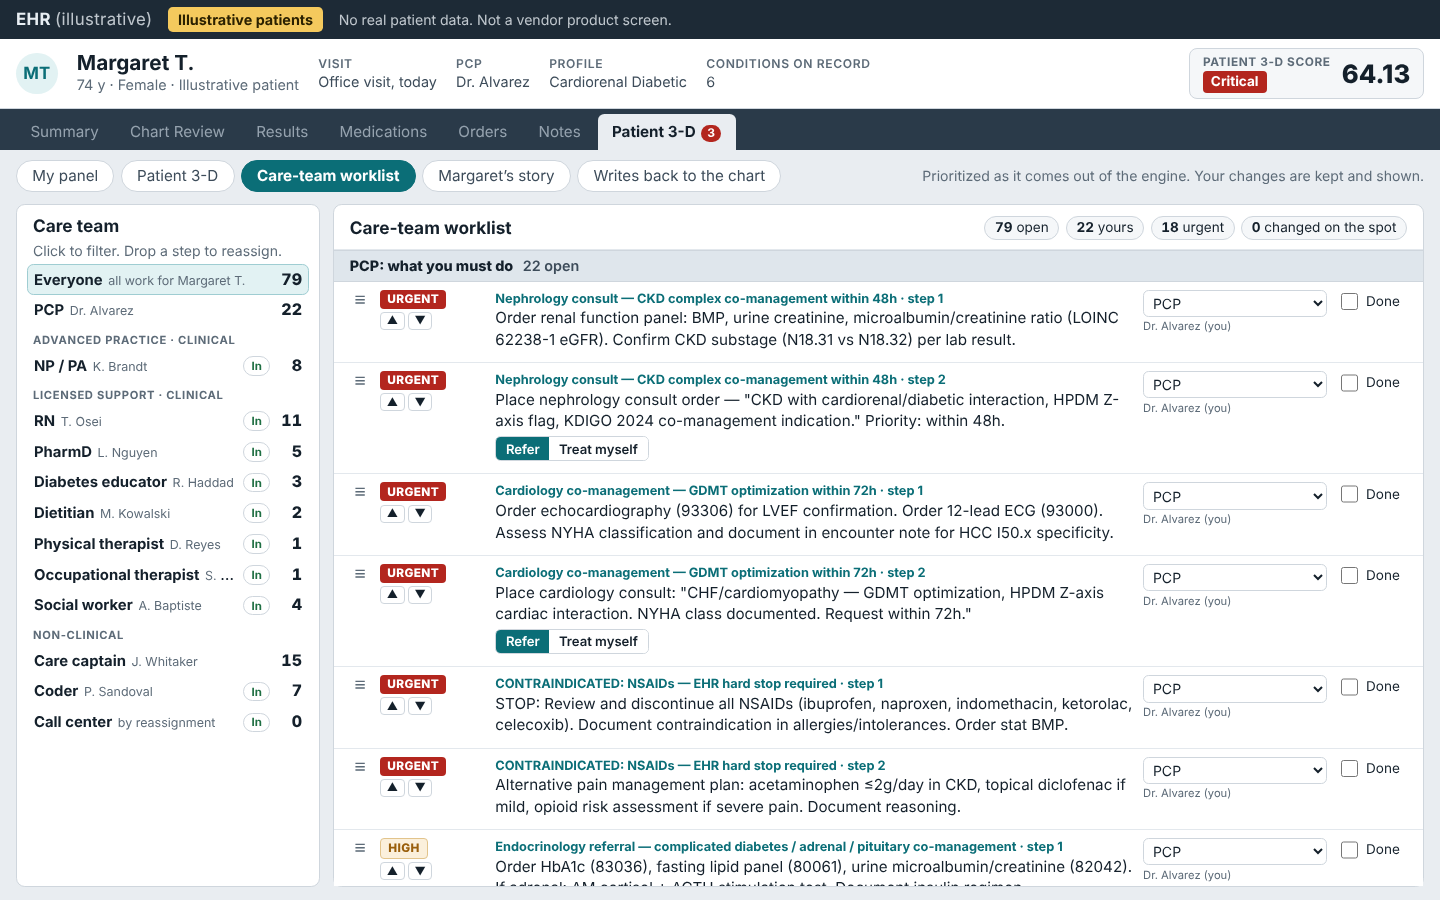
Two screens from the physician demo, captured at chart open. The EHR and the patients are illustrative.
What you get.
A ranked list at chart open
The patients whose conditions are compounding, in order, inside the workflow you already use.
The reason and the citation
For each one, the instrument grades, the interaction named, and the protocol with the guideline that calls for it.
The decision stays yours
The engine prepares the decision. Accept it, change it or dispute it — every response is recorded.
Five guidelines. One patient.
Researchers applied the national guideline for each of one woman’s five ordinary conditions. Each was written for one disease. She did not have one disease.
Source: Boyd et al., JAMAEach guideline written for one disease. She did not have one disease.
Her path, where you meet it.
The steps of the platform that land on your desk. Every one is a service already covered.
She is seen.
Her record arrives — the same record everyone had. The engine reads her conditions as one compounding trajectory and names what no single-disease guideline was watching for.
Her physician opens the chart.
The protocol is already there: nephrology within 48 hours, a medication reconciliation, a transitional-care visit — fired by her interactions, routed to the roles that own them, documented with the codes that pay for them.
Her care team runs on one queue.
A Care Captain, a nurse triage line that never closes, a community health worker for the ride she couldn’t get — dispatched by the protocol, not by whoever noticed first.
Her care is documented, billed and closed.
Each action acknowledged, completed or disputed, date-stamped. Chronic care management, remote monitoring, transitional care — services already covered, now activated.
Built by people who ran the systems it fixes — twenty years inside government health programs, PMO leadership across twenty-five-plus health plan launches, and a fourteen-seat clinical bench. Meet the team →
How it starts.
A proof of value: one extract under a data use agreement and your clinicians’ judgment, with nothing installed on your side. In production, Patient 3-D runs inside your environment, and your data never leaves it.
One extract under a data use agreement, delivered once.
A flat-file extract you already know how to produce, limited to the fields the analysis needs. We send the column spec; you send the file once.
A sealed U.S. environment.
The proof of value runs in a sealed environment in the United States, with no connection to your systems.
Your clinicians at the review table.
Your named clinical reviewers see every figure before any figure is released.
Results in weeks.
Your population measured in three dimensions — what each patient has, how severe, how it compounds. Weeks, not a program.
Destroyed, with a certificate.
When the work ends the environment is destroyed, and you receive a certificate of destruction.
See it on your data.
A flat-file extract, a sealed environment, your clinicians at the review table, results in weeks.